
I’ve been preparing a couple of Volca Sample tutorials before going on vacation, and this question came up when presenting the low-pass filter. What kind of filter does the Volca Sample ships with? in order to test it, I used sample 27. This sample is a small snare with not too much bass and quite a lot of white noise. I recorded this sample being played with the filter at 127, 110, 100, 90, 80, 70, 60, 50, 40, 30, 20, 10 and all closed. At first glance, the filter sounds like a 12dB/octave one. Figure 1 shows the wave shape of those samples (A), and their corresponding spectrogram (B).
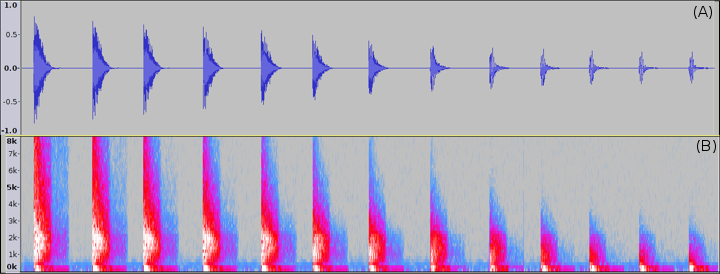
The spectrogram show that bellow a setting of 90, there is a substantial reduction in the high frequencies above 6 kHz. Also, a setting bellow 20 will mute everything above 3 kHz. I also plotted the spectrum of each sample using gnuplot. The resulting combined spectra shown in Figure 2. Although this is NOT a frequency response graph, it provides some insight on the behaviour of the filter.
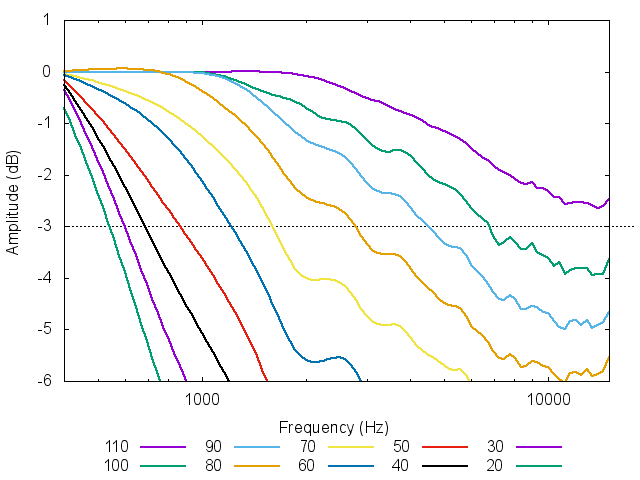
As expected from playing around wit the device, this filter does not present any noticeable resonance. Also, the cutoff frequency frequency appears to vary logarithmically with the knob setting. From Figure 2, the cutoff for an attenuation of -3dB appear to be (knob setting in parenthesis): 6.8 kHz(100); 4.5 kHz(90); 2.8 kHz(80); 1.6 kHz(70); 1.2 kHz(60); 860 Hz(50); and 680 Hz(40). For the lower settings, there is too litle information for a decent value, but it would appear that the -3dB attenuation for [HI CUT]=0 is set at the very low end of the audio range (perhaps 100Hz, or less).